Sidebar within card.pro
Sidebar containers are particularly useful for managing content that is infrequently accessed on an app page, as they provide a clean and organized way to hide secondary information without cluttering the main interface. By relegating less frequently used features or options to a sidebar, users can maintain focus on primary tasks while still having easy access to supplementary content when needed. This design approach enhances the overall user experience by allowing for a more streamlined and visually appealing layout. Additionally, sidebars can be collapsible or expandable, giving users the flexibility to customize their view according to their needs, thereby improving navigation efficiency and ensuring that important but rarely used functionalities remain readily accessible without overwhelming the main interface.
card.pro provides the sidebar feature, which the user may utilize using the sidebar argument. Below is an example code -
card.pro(
title = "Plot output",
plotOutput("distPlot"),
plotOutput("distPlot2"),
xtra.header.content = div(class = "c-red", "Downloading graph..."),
sidebar = div(
"Plot settings",
textInput("testy", "Y-axis title", "Concentration"),
textInput("testx", "X-axis title", "Time"),
textInput("dpi", "Image dpi", "300"),
textInput("strp", "Subset", "NA"),
actionButton("test3", "Re-graph")
)
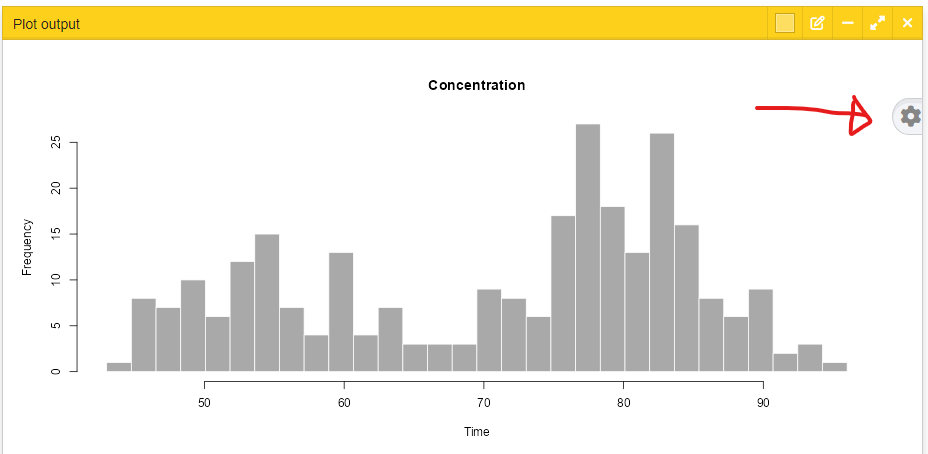
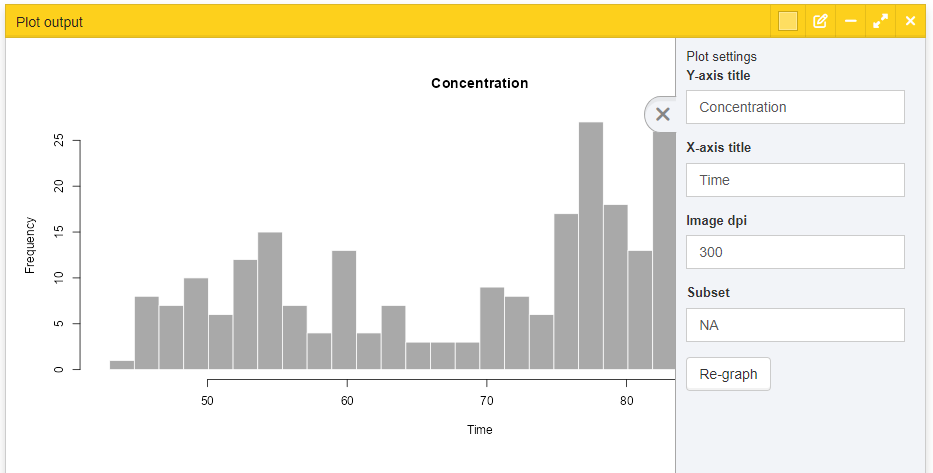
)In the above scenario, the sidebar is provided to conceal graph settings for the plot in the plotOutput. The user only toggles the sidebar when they feel it is needed to further optimize the output of the plotOutput. Below is a screenshot showing the sidebar BEFORE and AFTER toggle while using the shiny app.
The sidebar truly improves user experience and creates a lot more cleaner interface for the app.